Most engineers open AWS Cost Explorer exactly once — right after a billing alert fires at 2 AM. They spend an hour figuring out what caused a $400 spike, fix it, and close the tab. The dashboard stays closed until the next incident.
That's the wrong way to use it.
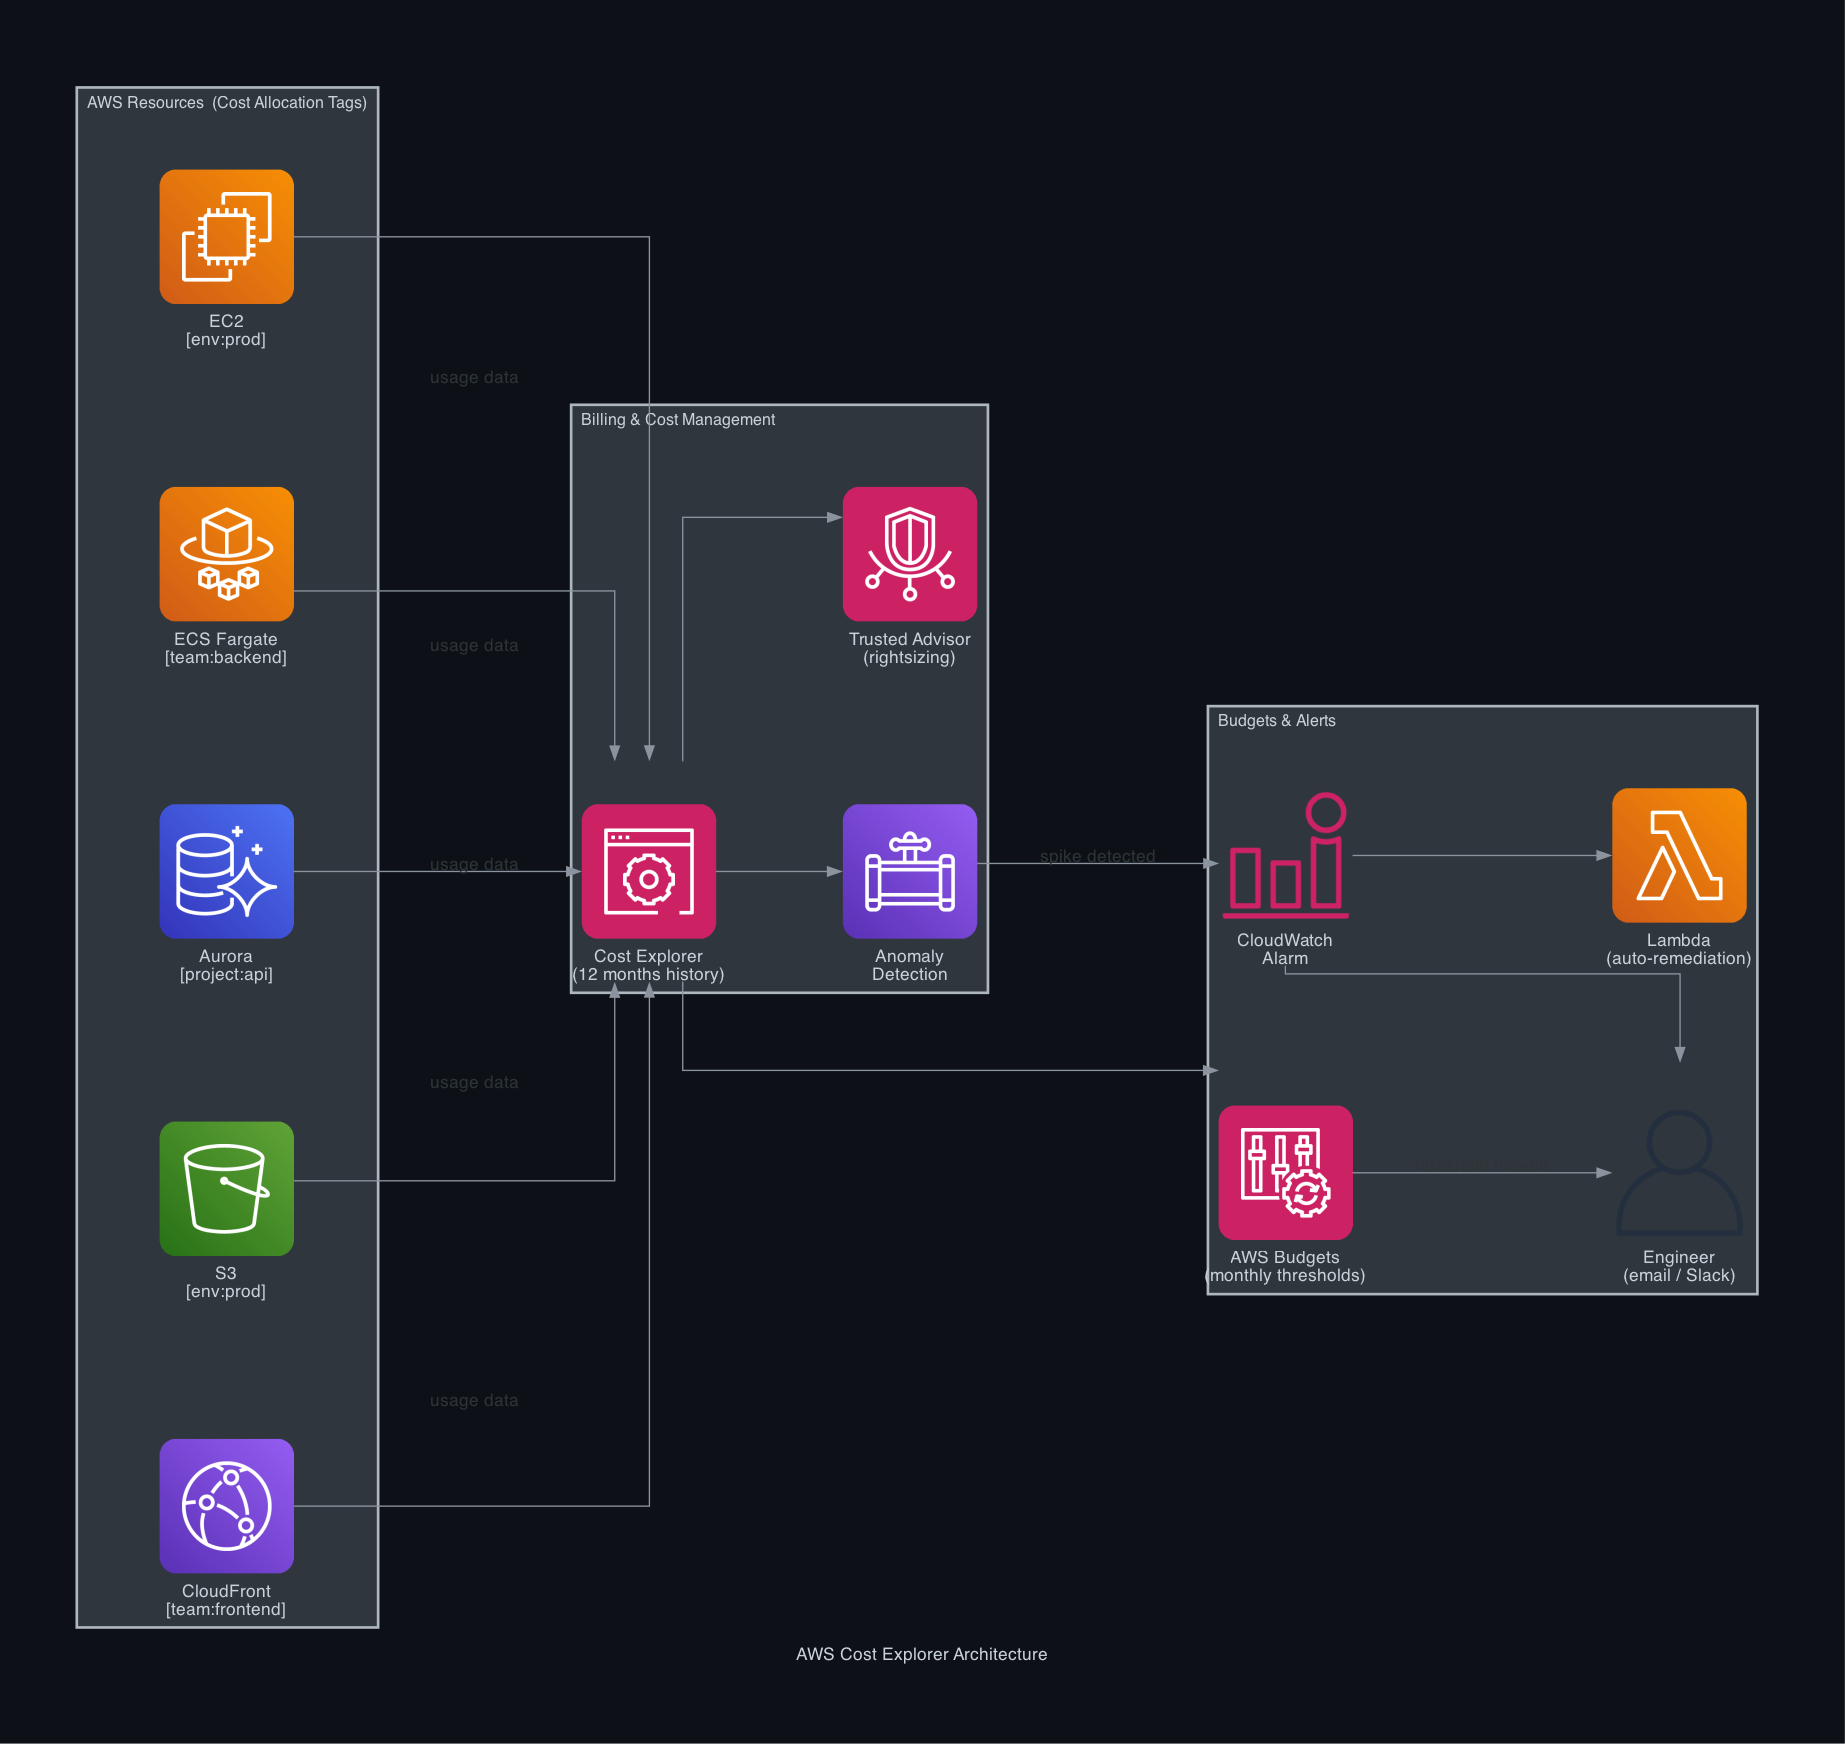
Cost Explorer is most useful as a proactive tool: a place you visit weekly, with views pre-configured to surface trends before they become incidents. This guide walks through building that setup from scratch — tagging strategy, the views that actually matter, anomaly detection, and automated budget alerts.
Enable Cost Explorer First
Cost Explorer is not enabled by default. Turn it on from the billing console — it can take up to 24 hours to populate historical data, so do this before you need it.
aws ce update-cost-allocation-tags-status \
  --cost-allocation-tags-with-status TagKey=env,Status=Active \
  --cost-allocation-tags-with-status TagKey=team,Status=Active \
  --cost-allocation-tags-with-status TagKey=project,Status=Active
Cost Explorer stores 12 months of billing history at no cost. The API has a charge of $0.01 per request — negligible for manual use, worth noting if you're building automated reports.
Step 1 — Cost Allocation Tags: The Foundation of Everything
Without tags, Cost Explorer shows you one number: your total AWS bill. With tags, it shows you how much each team, environment, and project costs independently. Tags are the single highest-leverage change you can make to your billing visibility.
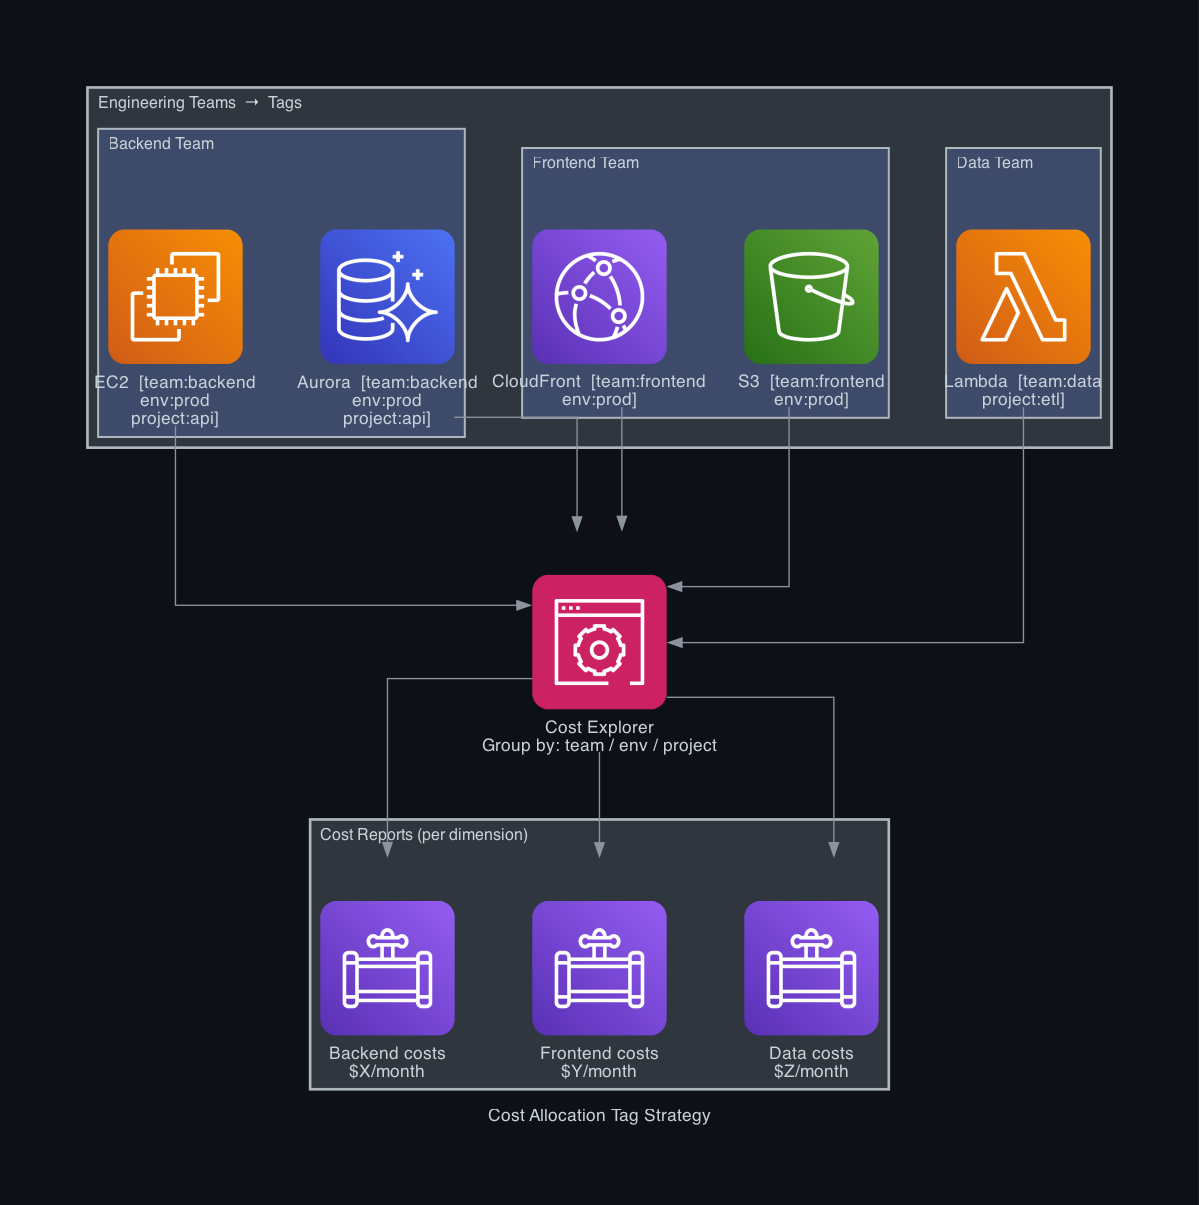
Define a tagging standard before you touch Cost Explorer. A minimal, consistent set works better than an elaborate one nobody follows:
| Tag Key | Example Values | Purpose |
| `env` | `prod`, `staging`, `dev` | Separate production costs from non-production |
| `team` | `backend`, `frontend`, `data` | Charge costs to the right team |
| `project` | `api`, `etl`, `auth-service` | Track per-feature or per-service spend |
Apply tags to every resource that generates cost — EC2, RDS, ECS services, S3 buckets, Lambda functions, NAT Gateways, and data transfer.
Enforce tags with AWS Config:
aws configservice put-config-rule --config-rule '{
  "ConfigRuleName": "required-tags",
  "Source": {
    "Owner": "AWS",
    "SourceIdentifier": "REQUIRED_TAGS"
  },
  "InputParameters": "{\"tag1Key\":\"env\",\"tag2Key\":\"team\",\"tag3Key\":\"project\"}"
}'
This flags any resource missing required tags as non-compliant — visible in the Config console and reportable via SNS. For full enforcement, combine it with an SCP (Service Control Policy) that denies resource creation without tags.
After applying tags, activate them as cost allocation tags in the Billing console under Cost Allocation Tags → User-Defined Tags. Changes take 24 hours to appear in Cost Explorer.
Step 2 — The Five Views to Build
Open Cost Explorer and save these as named reports. You'll come back to them every week.
1. Monthly spend by service
Group by: Service | Time: Monthly | Last 6 months
Your baseline. Shows which services are driving the bill and how the mix has changed over time. EC2, RDS, and data transfer are typically the top three. Any service growing faster than traffic warrants investigation.
2. Daily spend trend (current month)
Group by: Service | Time: Daily | This month
Catches intra-month spikes before they compound. A flat line is healthy. A sudden step-change on a specific day points to something deployed, misconfigured, or left running.
3. Cost by team
Group by: Tag team | Time: Monthly | Last 3 months
The view that enables accountability. Each team can see their own number. When the overall bill increases, you know immediately which team's spend changed. This also makes it easy to chargeback costs internally.
4. Environment cost split
Group by: Tag env | Time: Monthly
Your dev and staging environments should cost a fraction of prod. If they don't, you're either over-provisioned in lower environments or running things that should be off. A healthy ratio is roughly 10–15% of prod for all non-production combined.
5. Reserved Instance / Savings Plans coverage
Navigate to Cost Explorer → Reservations → Coverage or Savings Plans → Coverage
This shows what percentage of your on-demand usage is covered by RIs or Savings Plans. Anything below 70% on stable workloads means you're paying on-demand rates where you shouldn't be. Savings Plans for Fargate and Lambda can typically cut those compute costs 30–40%.
Step 3 — Anomaly Detection
AWS Cost Explorer Anomaly Detection monitors your spend continuously and alerts you when something deviates from its expected pattern — without you having to define thresholds manually.
Create an anomaly monitor and subscription:
# Create a monitor — watches spend across all services
aws ce create-anomaly-monitor \
  --anomaly-monitor '{
    "MonitorName": "AllServicesMonitor",
    "MonitorType": "DIMENSIONAL",
    "MonitorDimension": "SERVICE"
  }'
# Create an alert subscription — notified when anomaly exceeds $50
aws ce create-anomaly-subscription \
  --anomaly-subscription '{
    "SubscriptionName": "EngineeringAlerts",
    "MonitorArnList": ["<monitor-arn>"],
    "Subscribers": [
      {
        "Address": "engineering@yourcompany.com",
        "Type": "EMAIL"
      }
    ],
    "Threshold": 50,
    "Frequency": "IMMEDIATE"
  }'
Anomaly Detection uses ML to establish a baseline per service and flags deviations beyond a threshold you define. It catches things like:
- A developer left a GPU instance running over the weekend
- A misconfigured Lambda function executing in a tight loop
- Data transfer spiking because a CloudFront cache invalidation ran repeatedly
- RDS storage auto-scaling unexpectedly after a large data import
The IMMEDIATE frequency means you get alerted within hours of a spike, not at month-end.
Step 4 — Budgets with Automated Alerts
Anomaly Detection catches unexpected patterns. Budgets catch expected patterns that exceed your targets — like a service that's growing predictably but faster than planned.
Create a monthly budget with two alert thresholds:
aws budgets create-budget \
  --account-id <account-id> \
  --budget '{
    "BudgetName": "MonthlyAwsBudget",
    "BudgetLimit": { "Amount": "2000", "Unit": "USD" },
    "BudgetType": "COST",
    "TimeUnit": "MONTHLY",
    "CostFilters": {},
    "CostTypes": {
      "IncludeTax": true,
      "IncludeSubscription": true,
      "UseBlended": false
    }
  }' \
  --notifications-with-subscribers '[
    {
      "Notification": {
        "NotificationType": "ACTUAL",
        "ComparisonOperator": "GREATER_THAN",
        "Threshold": 80,
        "ThresholdType": "PERCENTAGE"
      },
      "Subscribers": [{ "SubscriptionType": "EMAIL", "Address": "engineering@yourcompany.com" }]
    },
    {
      "Notification": {
        "NotificationType": "FORECASTED",
        "ComparisonOperator": "GREATER_THAN",
        "Threshold": 100,
        "ThresholdType": "PERCENTAGE"
      },
      "Subscribers": [{ "SubscriptionType": "EMAIL", "Address": "engineering@yourcompany.com" }]
    }
  ]'
Two thresholds worth having:
- 80% of actual spend — early warning while you can still react
- 100% of forecasted spend — alerts you when the month's trajectory will exceed budget, even if you haven't hit it yet
The forecasted threshold is the more powerful one. It fires mid-month based on Cost Explorer's spend projection — giving you 2 weeks to act rather than an end-of-month surprise.
Step 5 — Rightsizing with Trusted Advisor
Once you have visibility, use Trusted Advisor → Cost Optimization to find specific resources to change.
# List all Trusted Advisor cost checks
aws support describe-trusted-advisor-checks \
  --language en \
  --query 'checks[?category==`cost_optimizing`].[id,name]' \
  --output table
# Get results for a specific check (e.g., underutilised EC2)
aws support describe-trusted-advisor-check-result \
  --check-id "Qch7DwouX1" \
  --query 'result.flaggedResources[*].{Region:metadata[0],Instance:metadata[1],Savings:metadata[5]}'
Trusted Advisor surfaces:
- Underutilised EC2 instances — running at less than 10% CPU over 14 days, with estimated monthly savings
- Idle RDS instances — no connections in the last 7 days
- Unassociated Elastic IPs — $0.005/hr each when not attached
- Low-utilisation load balancers — ALBs with less than 5 requests/day for 7 days
These are not theoretical savings — they're specific resource IDs with dollar amounts attached. Each one is an action item, not a recommendation.
Step 6 — Automate Cost Reports to Slack
Manual dashboard checks get skipped. A weekly automated report forces visibility.
import boto3, json
# lambda
def lambda_handler(event, context):
    ce = boto3.client('ce')
    # Get month-to-date spend by service
    response = ce.get_cost_and_usage(
        TimePeriod={
            'Start': '2026-03-01',
            'End':   '2026-03-25'
        },
        Granularity='MONTHLY',
        Metrics=['UnblendedCost'],
        GroupBy=[{'Type': 'DIMENSION', 'Key': 'SERVICE'}]
    )
    top_services = sorted(
        response['ResultsByTime'][0]['Groups'],
        key=lambda x: float(x['Metrics']['UnblendedCost']['Amount']),
        reverse=True
    )[:5]
    lines = ["*AWS Cost Report — Top 5 Services MTD*"]
    for svc in top_services:
        name = svc['Keys'][0]
        cost = float(svc['Metrics']['UnblendedCost']['Amount'])
        lines.append(f"• {name}: ${cost:.2f}")
    # Post to Slack webhook
    import urllib.request
    payload = json.dumps({"text": "\n".join(lines)}).encode()
    req = urllib.request.Request(
        "<SLACK_WEBHOOK_URL>",
        data=payload,
        headers={"Content-Type": "application/json"}
    )
    urllib.request.urlopen(req)
Schedule this Lambda with EventBridge on Monday mornings:
aws events put-rule --name WeeklyCostReport --schedule-expression "cron(0 8 ? * MON *)" --state ENABLED
aws events put-targets --rule WeeklyCostReport --targets "Id=CostReportFn,Arn=<lambda-arn>"
A Monday morning Slack message with last week's top spenders keeps cost visible to the whole team without anyone having to remember to check.
Quick Reference
| What | Where |
| Enable Cost Explorer | Billing Console → Cost Explorer → Enable |
| Activate cost allocation tags | Billing Console → Cost Allocation Tags → Activate |
| View spend by team | Cost Explorer → Group by Tag: `team` |
| Set up anomaly detection | Cost Explorer → Anomaly Detection → Create Monitor |
| Create a budget | AWS Budgets → Create Budget |
| Find idle resources | Trusted Advisor → Cost Optimization |
| Rightsizing recommendations | Cost Explorer → Rightsizing Recommendations |
| Savings Plans coverage | Cost Explorer → Savings Plans → Coverage |